計量分析で使ったモデルの説明用に因果ダイアグラム(DAG)をGraphvizで描いてみましょう。LibreOfficeのDrawを使うほうが手っ取り早い気もしますが、TeXやMarkdown記法を使っていて、DVCで管理している場合は差分が分かりやすいこちらの方が良いかも知れません。
インストール方法*1の解説*2も、詳しいオプションの説明ページ*3も既にあるので、実際に簡単なDAGを描いてみます。DAGを描く分にはGraphvizの表示機能のごく一部しか使わないので、隅から隅まで目を通す必要は無いです。
内生変数を説明する例(と画像生成コマンド)
以下のファイルを用意して
digraph example1 {
  graph [
    charset = "UTF-8";
    label = "A Simultaneous Equation Model"
    fontname = "HackGen35 Console NF" # WindowsだとMeriryo UIなど
    rankdir = RL # 右から左に描いていく; 左から右はLR,上から下はTB
  ]
  # 標準設定
  node [
    shape = plaintext # 枠なし
    fontname = "Latin Modern Roman" # ローマン体を指定しておく;WindowsだとTimes New Romanなど
  ]
  edge [
    fontname = "Latin Modern Roman"
  ]
  # 個々のノードの設定
  # HTML-like記法でイタリックの下付き文字ありラベルにする
  z [label = <<i>z<sub>i</sub></i>>]
  x [label = <<i>x<sub>i</sub></i>>]
  y [label = <<i>y<sub>i</sub></i>>]
  # ノード間の関係(edge; 線)を記述
  z -> x -> y
  y -> x [headport = s, tailport = s] # エッジ(と言うか線)の始点と終点の位置を調整 n:上(north), e:右(east),s:下(south),w:左(west)
}
以下のようにコンパイルすると、
dot -Tpng example01.dot > example01.png
画像ファイルができます。
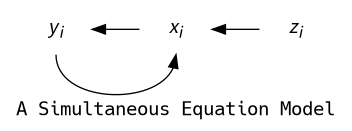
PDFファイルを出力する場合は、-Tpngを-Tpdfにします*4。SVGの場合は-Tsvgです*5。
TeXの数式のフォントがローマン体の斜体になるので、図もHTML-likeであわせたフォントにした方がよいと思いますが、ラベルはダブルコーテーションでくくったテキストファイルでもよく、そのときは \n で改行を入れられます。
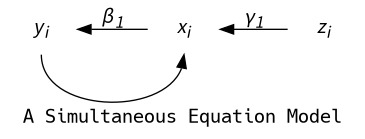
ラベルにギリシャ文字を入れる例
UTF-8の特殊文字を使ってもよいのですが、HTMLの数値参照記法を使う方が楽だと思います。
digraph example2 { graph [ charset = "UTF-8"; label = "A Simultaneous Equation Model" fontname = "HackGen35 Console NF" rankdir = RL ] node [ shape = plaintext fontname = "Latin Modern Roman" ] edge [ fontname = "Latin Modern Roman" ] z [label = <<i>z<sub>i</sub></i>>] x [label = <<i>x<sub>i</sub></i>>] y [label = <<i>y<sub>i</sub></i>>] z -> x [label = <<i>γ<sub>1</sub></i>>] x -> y [label = <<i>β<sub>1</sub></i>>] y -> x [headport = s, tailport = s] }
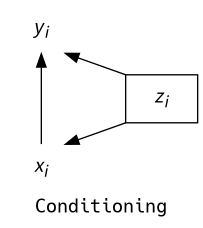
条件付けを描く例
ノードを四角で囲うだけですが、横一列のレイアウトにならないようにします。
digraph example3 {
  graph [
    charset = "UTF-8";
    label = "Conditioning"
    fontname = "HackGen35 Console NF"
    layout = circo # 放射状のレイアウトにする
  ]
  node [
    shape = plaintext
    fontname = "Latin Modern Roman"
  ]
  edge [
    fontname = "Latin Modern Roman"
  ]
  x [label = <<i>x<sub>i</sub></i>>]
  y [label = <<i>y<sub>i</sub></i>>]
  z [label = <<i>z<sub>i</sub></i>>, shape = box] # 四角で囲う
  x -> y
  z -> x [headport = ne, tailport = sw]
  z -> y [headport = se, tailport = nw]
}
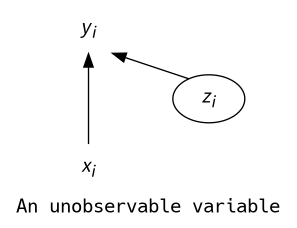
観測不能な変数を描く例
ノードを丸で囲うだけですが、透明のエッジ(線)を描くことでレイアウトのバランスをとります。
digraph example4 {
  graph [
    charset = "UTF-8";
    label = "An unobservable variable"
    fontname = "HackGen35 Console NF"
    layout = circo
  ]
  node [
    shape = plaintext
    fontname = "Latin Modern Roman"
  ]
  edge [
    fontname = "Latin Modern Roman"
  ]
  x [label = <<i>x<sub>i</sub></i>>]
  y [label = <<i>y<sub>i</sub></i>>]
  z [label = <<i>z<sub>i</sub></i>>, shape = oval] # 楕円で囲う
  x -> y
  z -> x [style = invis] # 線を透明指定
  z -> y [headport = se, tailport = nw]
}
横一列に並べた実践的な例
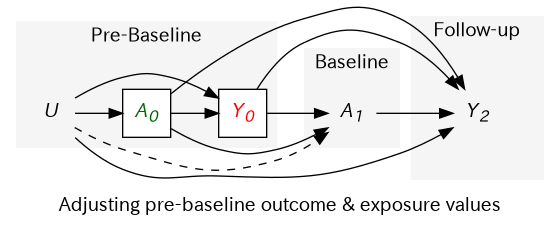
変則的な例ですが、このツイートの添付画像を模倣してみましょう。
- 横一列に並べる努力をします。rankdir = LRで左から右にノードが連なるわけですが、線を結ぶと線が重ならいようにレイアウトの上下の位置が調整されます。これを避けるために、横一直線となる線以外の線のweightを0にします。
- subgraphをつくり、style = filled; fillcolor = "#F5F5F5"で背景色をつけます。枠線はperipheries = 0で消します。
微妙に違いますが、だいたい同じと言うことで。
digraph example5 {
  graph [
    charset = "UTF-8";
    label = "Adjusting pre-baseline outcome & exposure values"
    fontname = "HackGen35 Console NF"
    rankdir = LR
  ]
  node [
    shape = plaintext
    width = 0.5 # 標準では余白多めになるので、幅を狭くしておく
    fontname = "Latin Modern Roman"
  ]
  edge [
    fontname = "Latin Modern Roman"
    weight = 0
  ]
  # subgraphの名前は必ずcluster_ではじめないといけない
  subgraph cluster_0 {
    label = "Pre-Baseline"
    style = filled
    fillcolor = "#F5F5F5"
    peripheries = 0
    U [label = <<i>U</i>>]
    A0 [label = <<i>A<sub>0</sub></i>>, shape = box, style = filled, fillcolor = white, fontcolor = darkgreen]
    Y0 [label = <<i>Y<sub>0</sub></i>>, shape = box, style = filled, fillcolor = white, fontcolor = red]
  }
  subgraph cluster_1 {
    label = "Baseline"
    style = filled
    fillcolor = "#F5F5F5"
    peripheries = 0
    A1 [label = <<i>A<sub>1</sub></i>>]
  }
  subgraph cluster_2 {
    label = "Follow-up"
    style = filled
    fillcolor = "#F5F5F5"
    peripheries = 0
    margin = 32 # ラベルに線が重ならないように、サブグラフのサイズを拡大して調整
    Y2 [label = <<i>Y<sub>2</sub></i>>]
  }
  U -> A0 -> Y0 -> A1 -> Y2 [weight = 1]
  U -> Y0
  U -> A1 [style = dashed]
  U -> Y2
  A0 -> A1
  A0 -> Y2
  Y0 -> Y2
}
特殊記号(合成可能記号)
DAGで使う事は無さそうですが、UTF-8のHTMLでは数値参照入力を使えば利用できます。例えばハット、チルダ、バー、ドットの場合は、以下のように入力できます。
| Combining Diaeresis Symbols | Example | HTML(UTF-8) | LaTeX |
|---|---|---|---|
| hat | ẑ | ẑ | ¥hat{z} |
| tilde | z̃ | z̃ | ¥tilde{z} |
| bar | z̄ | z̄ | ¥bar{z} |
| dot | ż | ż | ¥.{z} |
| Umlaut | z̈ | z̈ | ¥"{z} |
dot言語HTML-like記法でノードのラベルをz̄とする場合は、
z_bar [label = <<i>z̄</i>>]
と言うように記述します。
*1:Ubuntu Linuxだとsudo apt install graphvizでインストールできます。
*2: Graphvizをインストールする #Graphiz - Qiita
*3: Graphvizとdot言語でグラフを描く方法のまとめ #Graphviz - Qiita
*4:EPSも出せるのですが、後述のUTF-8の合成可能記号を混ぜるとエラーが出ます。
*5:上付き下付き文字の処理がイマイチでした。
